Viewing Emission Targets
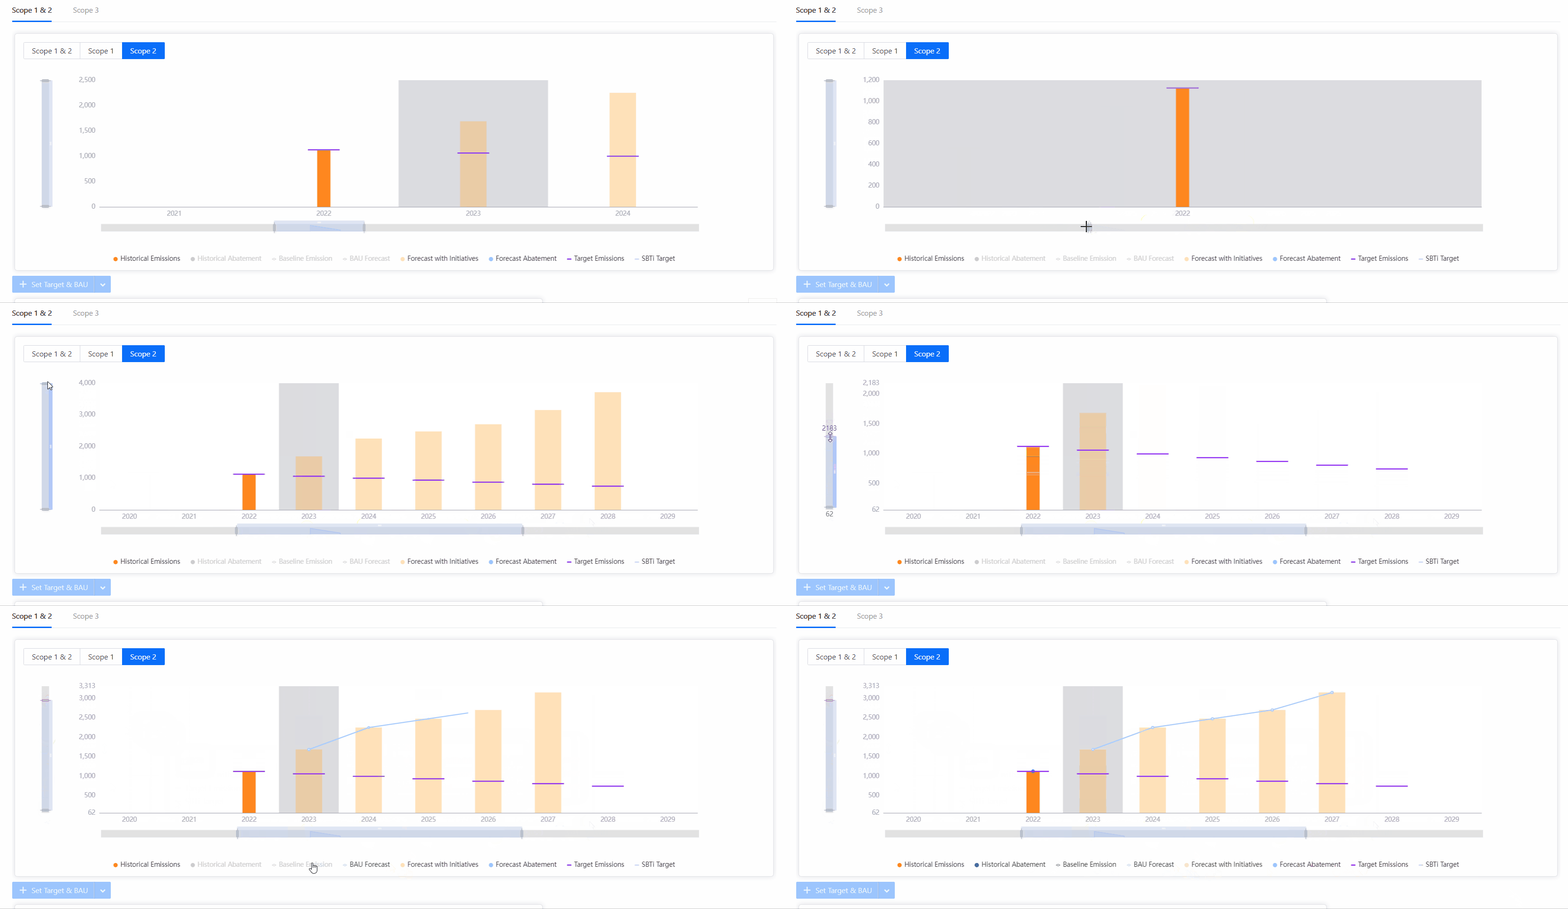
Once saved, you can visualize the target setting pathways on the target management dashboard. To adjust the view scope and focus on specific areas of the data visualization, you can extend or minimize the scroll bar on the x or y-axis accordingly.

Dashboard legends are located below the data dashboard, you can click on them to hide and filter data parameters on the data dashboard display.
View Targets Data
In the target details menu, click on the View button  to review targeted emissions data.
View Forecasted Abatement Effects
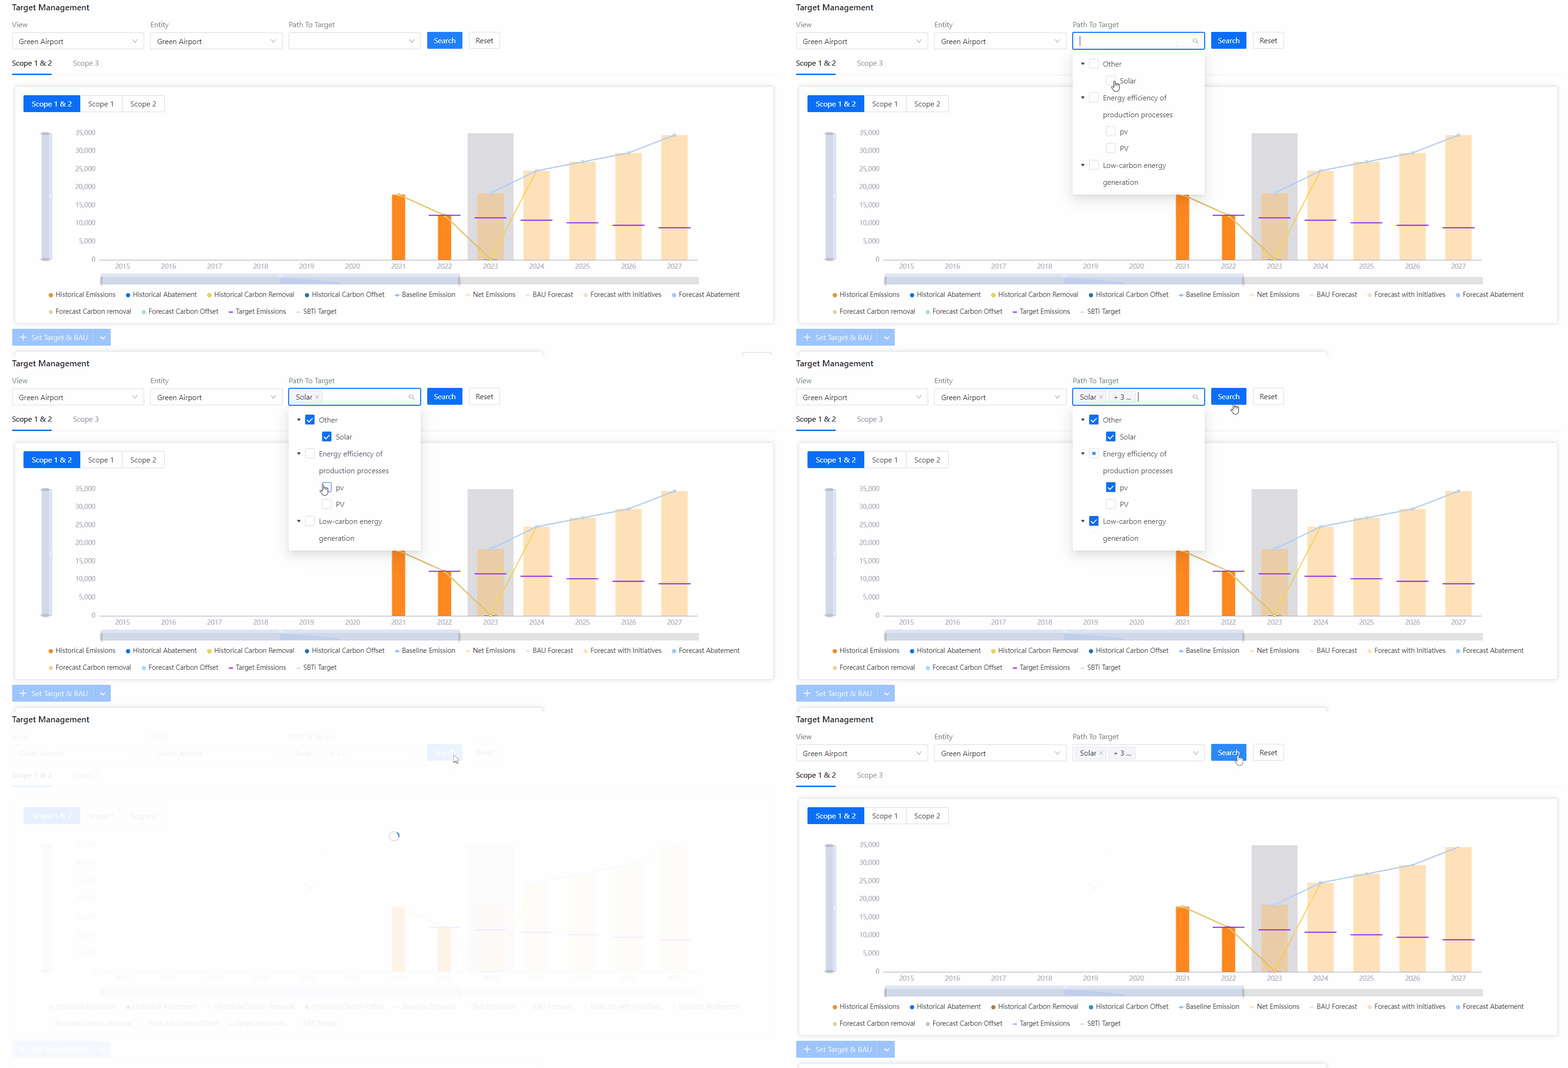
The path to target feature utilizes data from your recorded estimated abatement initiatives to visualize how your sustainability efforts will contribute to your carbon reduction goals over time in the target management dashboard.

Select relevant abatement initiatives in the Path to Target dropdown list and click Search to see how these initiatives will impact your carbon reduction targets on the visualization dashboard. This also allows you to evaluate the effectiveness of your sustainability efforts.