Quick Start
Recommended Computer Set Up
Recommended Resolution: 1920*1080, 1280*720
Operating System: Windows 8/9/10, MacOS, Linux
Browser:
Google Chrome114.0.5735.199 (64-bit) or aboveMicrosoft Edge114.0.1823.82 (64-bit) or above
Login to Ark
Open Google Chrome
 .
.Go to EnOS Ark Login Interface.
Key in your login details, and click Login.
Getting Started with the Ark Interface
After logging in, click on Organization in the left navigation pane to begin.
You will be directed to the Preview Dashboard page, where you can view the emission data across your business group or organization. You can proceed to create organization entity details, group and organize business entity structures in the Editor Dashboard by clicking Configuration in the toolbar.
Exploring the Preview Dashboard
This is where you preview the overall emission data of your organization created from the editor dashboard.
To get to the Preview Dashboard page:
Click on Organization in the left navigation pane, or
Or from the Editor Dashboard, click on the Preview button.
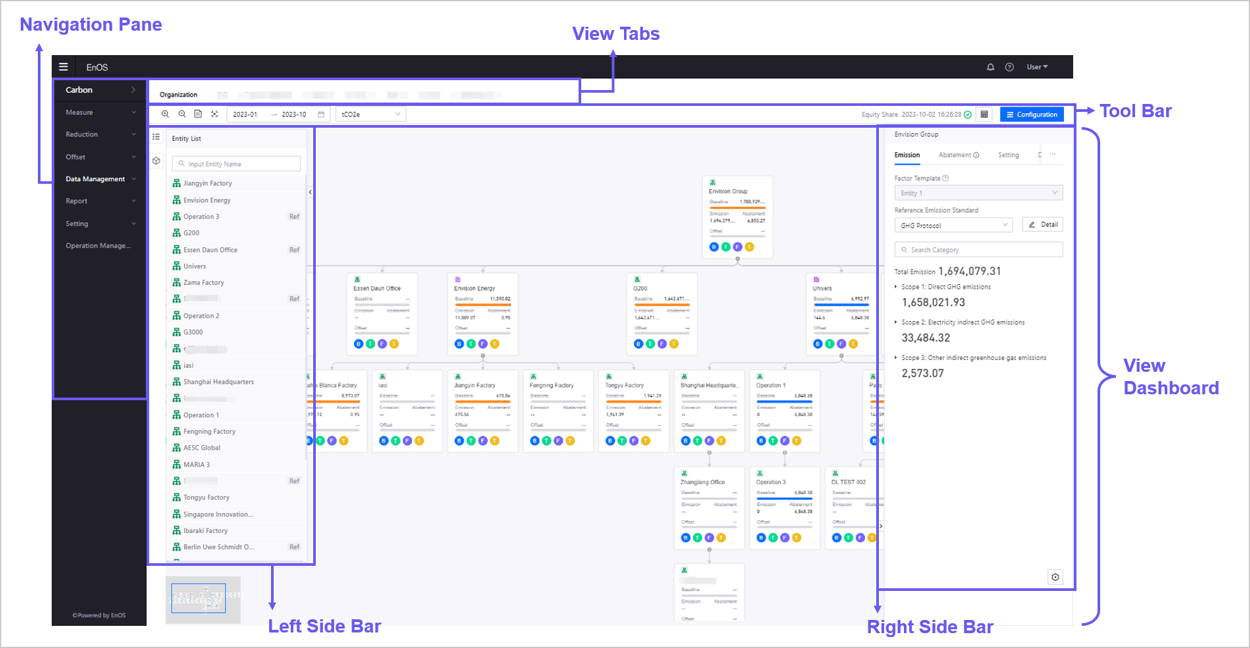
View Tabs
The emission pages you have created for your organization are listed here in tabs.
Tool Bar
Adjust view settings here to manage dashboard display, filter emission data, update accounting mode and switch to configuration settings (editor dashboard).
Zoom in
 / Zoom Out
  : zoom-in or zoom-out page to adjust the dashboard display pane size.
Reset zoom
 : reset zoom scale of display pane back to default.
Centralize display
 : centralize view back to center of the dashboard.
Time filter
 : set a custom start and end range to display emission data within a specified time frame.
Unit Switch
 : Switch the unit of data calculation.
View Dashboard
Organization emission data display pane. Once you have filed in emission data in Data Entry and configured necessary settings in Editor Dashboard, you will be able to preview your organization’s complete emission data here.
Left Side Bar
Quick search to locate entities and models.
Note
Side bars are hidden by default, click on  to expand side bar contents.
Right Side Bar
Preview emission, abatement,settings, data and offset information of your configured entities.
Note
Expand right side bar by clicking on  to the right of the dashboard, or by clicking on any entity card displayed.
Exploring the Editor Dashboard
This is where you create, arrange and update your organization’s hierarchy structure to capture emissions across multiple regional offices, value chain assets, and emission sources.
To get to the Editor Dashboard page:
Click on Organization in the left navigation pane, and click Configuration in the tool bar.

View Tabs
Create new views, delete views, or make edits to the views you have already created in the tabs. For more information, see Managing views.
Tool Bar
Adjust view settings here to manage dashboard display or switch back to preview dashboard.
View Editor
Create new entities, reference entities, or update entity information here to reconstruct your organization structure and capture emission data composition accurately. For more information, see Setting Up the Emission Entity.
Left Side Bar
Create entities and models and manage them in the entity and model list library. For more information, see Setting Up the Emission Entity.
Right Side Bar
Update emission source, settings, and data information of your configured entities here. For more information, see Setting Up Entity Configurations.
Exploring the Data Entry Page
The table below explains the menu items in the data entry page.
Menu Items |
Description |
|---|---|
|
Input emissions by Scope 1, 2, 3 |
|
Input emissions by category |
|
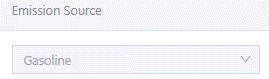
Define emissions source of your data input |
|
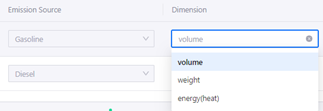
Define emission dimension according to the emission source |
|
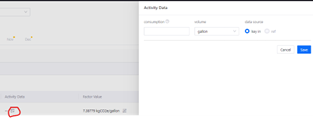
Input activity data |
|
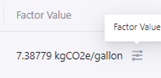
Select an emission conversion value from the factor library to calculate the likely emission size of your emission activity |
|
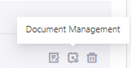
Add notes for the emissions recorded. |
|
Associate files related to data investigations. |