Evaluating Marginal Abatement Cost Curve
The Marginal Abatement Cost Curve (MACC) is a tool that helps organization assess the cost of reducing one ton of carbon dioxide within their abatement projects. MACC measures and compares the financial cost and reduction potential of individual projects, and ranks abatement initiatives based on cost per ton of CO2 or tons reduced.
By visualizing costs or savings associated with each project opportunity in relation to the potential emissions reduction volume achievable upon implementation, MACC helps organizations identify cost-effective abatement strategies to focus on to achieve maximum results while minimizing operational expenses.
Enter Abatement Initiative Cost Details
Prerequisites
Contact your system administrator if your account does not meet the below requirements:
Ensure your account has the
operator,view adminorsuper adminrole for access to marginal abatement cost curve feature.Ensure your account has permission to manage the relevant entity data.
Ensure you have followed necessary steps to create abatement initiatives records and have entered abatement data within the project cycle. MACC information is stored within the created initiative records.
Ensure you have clicked on the accounting icon
 in Data Management > Organization view page, and the data accounting is successful.
Click on Data Management > Organization in the left navigation pane. Select the view and entity that you want to record MACC data.
In the right side bar, locate your abatement card under the abatement tab and click the edit button
 to open the information pop-up window.
Turn on the MACC switch button to expand the MACC details form, fill in cost details of your abatement project:
Project Start Year: Enter project starting year.
Project Life: Estimated duration of project from start to completion in years.
Cost Change from this initiative (Year): Estimated cost savings resulting from the implementation of this initiative. Typically, this value is negative.
Note
In most cases, implementing abatement measures leads to a reduction in energy costs, which should be recorded as negative values.
Salvage value: Estimated residual value of asset at the end of useful life or at the end of project phase.
Discount rate: Rate of return used to discount future cash flows back to their present value.
Cost of Finance (Finance Period): Duration of finance payments in years.
Cost of Finance (Annual Payment): Amount of finance payments generated per year.
Ongoing Revenue (Year): Average revenue achieved from the selected abatement initiative in a year. (if applicable)
Ongoing Operating Costs (Year): Average operating cost of the selected abatement initiative in a year.
Click OK to save the data into system and generate MACC analysis visualization.
View Marginal Abatement Cost Curve Analysis
To preview marginal abatement cost curve visualization results:
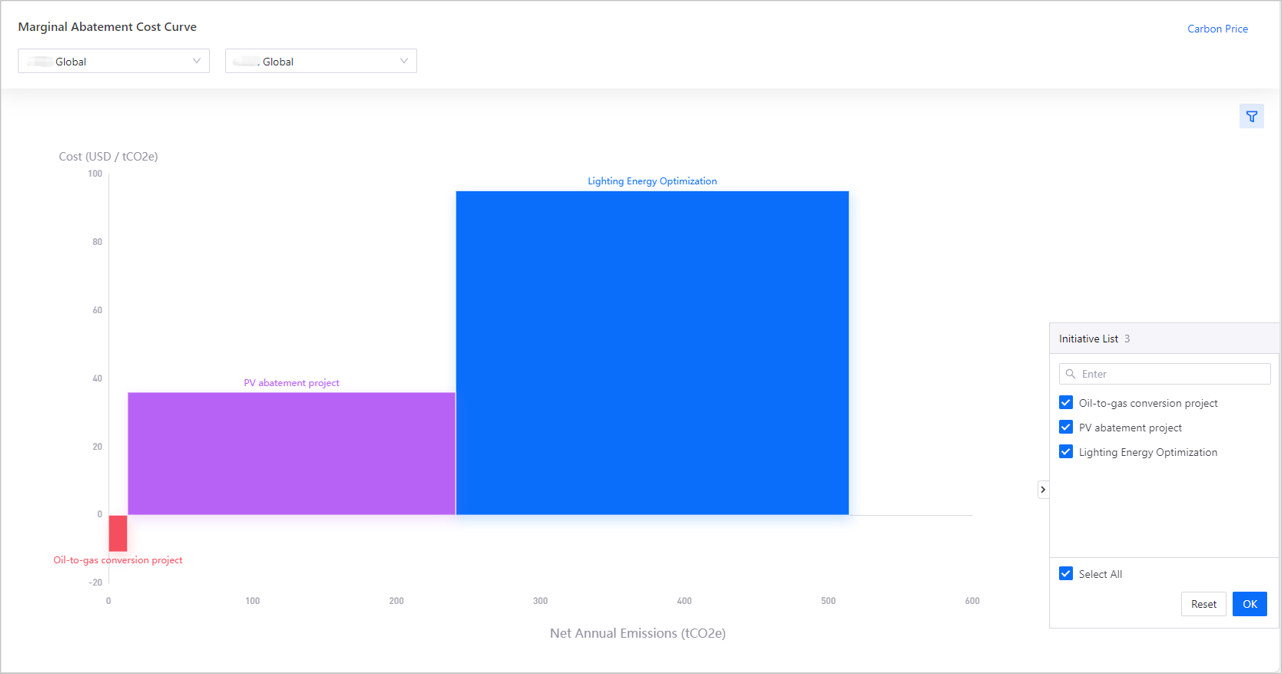
Click on Target and Abatement > MACC in the left navigation pane. Select the view and entity that you want to view MACC analysis data.
In the initiative list panel, select the abatement project(s) you wish to compare.
Click OK and you will see the selected project’s MACC value visualized on the dashboard.
Alternatively, you can also adjust preview settings to visualize other parameters:
Click on the filter button to open preview settings panel.
X-axis: You can change x-axis value to display
Net Annual EmissionsorTotal Abatement.Year: You can switch between years to see changes in MACC results, if you have recorded cost details for other years.
Year of Carbon Price: You can select a year to display prevailing carbon price to evaluate the impact of energy prices on operations.
Note
To display carbon pricing on the graph, click on
Carbon Priceon the top right corner and enter the current carbon pricing to be shown for each year.
Understand Marginal Abatement Cost Curve
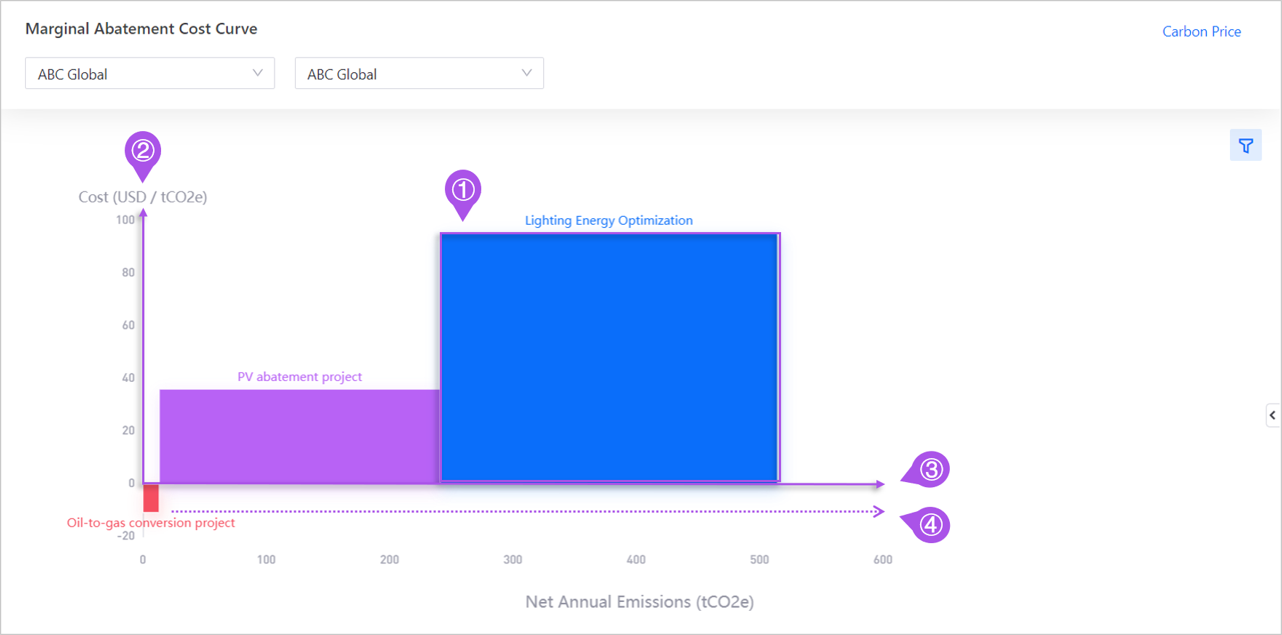
The table below explains the menu items in the marginal abatement cost curve graph.
Menu Items |
Description |
|---|---|
① Box Bar |
Each represents an emission reduction project/abatement initiative. |
② Y-axis |
Measures the marginal abatement cost per project ($/tCO2e). Note: If you need to change the currency unit, please contact the system administrator. |
③ X-axis (adjustable) |
You can select one of these values for the x-axis using the filter button:
|
④ Box Bar Order Placement |
Box bars are sorted from left to right according to the annual marginal cost incurred for each abatement initiative measured on the Y-axis, from the lowest to highest. |
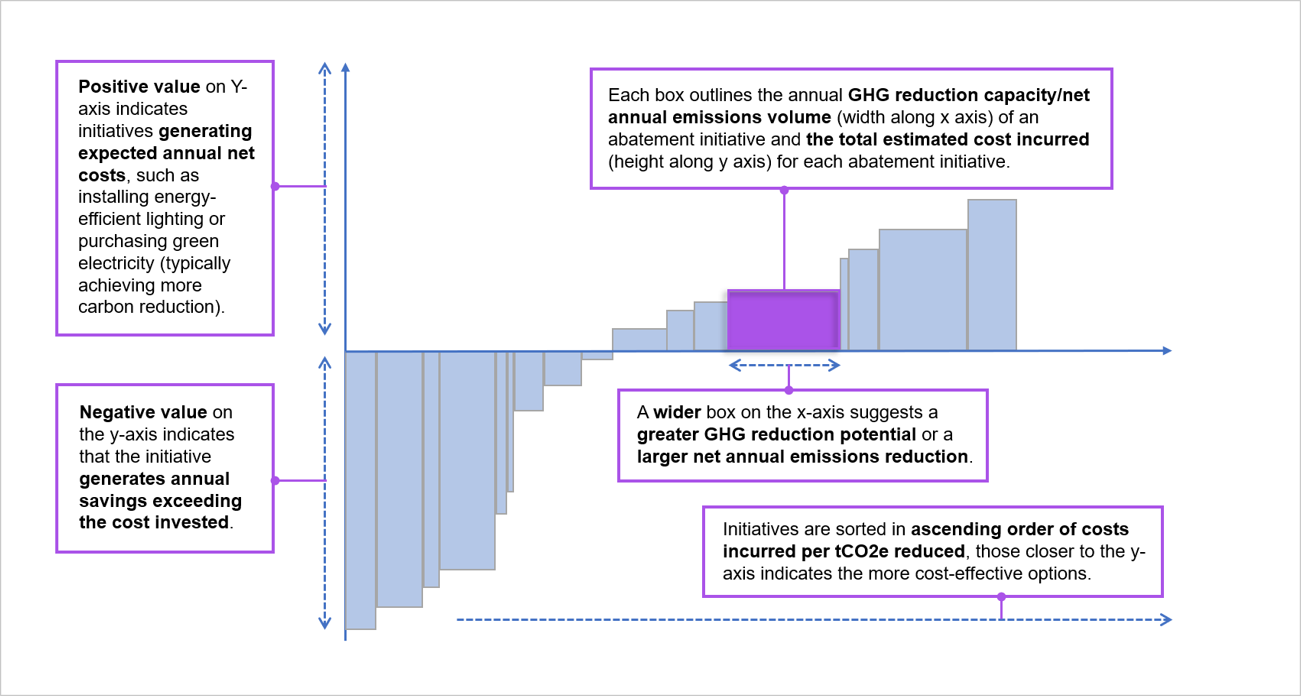
How to Read a Standard Marginal Abatement Cost Curve